Walnut Nitrogen Uptake and Partitioning
The Fertilization guidelines can also be found on the UC Davis Nutrient Management website .
Seasonal N Uptake
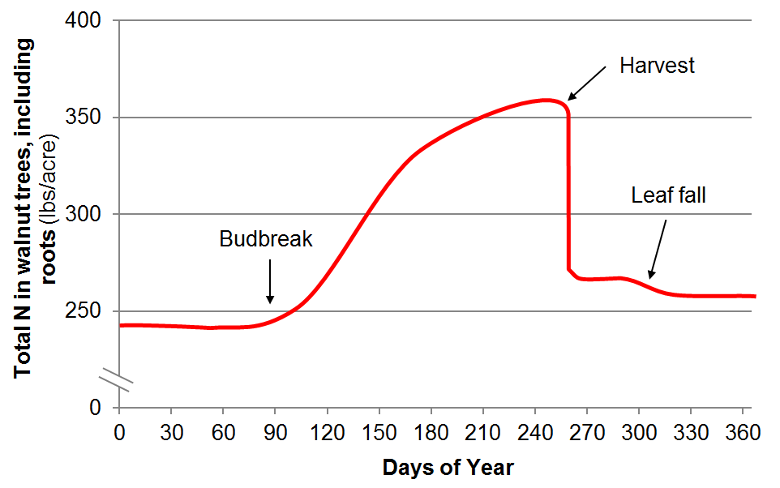
Seasonal pattern of N in walnut trees. Nitrogen uptake from soil starts after bud break and is greatest between the onset of shoot growth and the latter stages of nut fill [1,4].
Nitrogen Partitioning
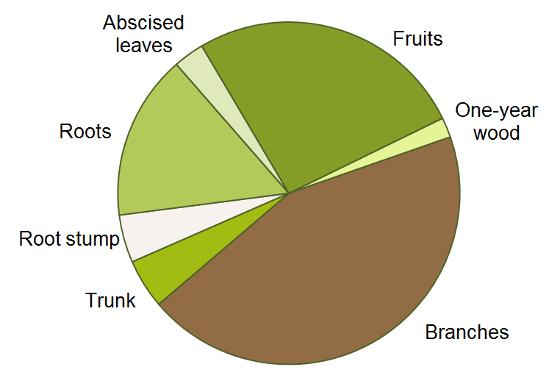
Nitrogen distribution in 16-year old 'Hartley' walnut trees with a yield of 2.2 tons/acre [4].
Nitrogen Removed at Harvest
Nitrogen removed with harvested walnuts. The value includes all nutrients removed in hulls, shells and kernels. The overall average is weighted for the number of observations in each trial. More information can be found herehref="#References">[3].
| Location | Years | Removal (lbs N/ton of nuts) | Source | |
|---|---|---|---|---|
| Mean | Range | |||
| Stanislaus, CA | 1985-90 | 40.5 | 34-46.4 | [4] |
| Central Valley, CA | 2013-14 | 27.5 | 24-32.6 | [2] |
| Weighted Average | 31.9 | 24-46.4 | ||
Links
References
- Anderson, K.K., Grant, J., Weinbaum, S.A., Pettygrove, S., 2006. Guide to efficient nitrogen fertilizer use in walnut orchards. University of California, Agriculture and Natural Resources. Publication 21623.
- DeJong, T., Pope, K., Brown, P., Lampinen, B., Hopmans, J., Fulton, A., Buchner, R., Grant J., 2015. Development of a nutrient budget approach and optimization of fertilizer management in walnut. Walnut Research Reports 2015.
- Geisseler, D., 2016. Nitrogen concentrations in harvested plant parts -A literature overview. Report to the Kings River Watershed Coalition.
- Weinbaum, S.A., Murooka, T.T., Gatlin, P.B., Kelley, K., 1991. Utilization of fertilizer N by walnut trees. The Walnut Marketing Board of California. Walnut Research Reports 1991, 317-334.