Strawberry Nitrogen Uptake and Partitioning
The Fertilization guidelines can also be found on the UC Davis Nutrient Management website .
Seasonal N Uptake
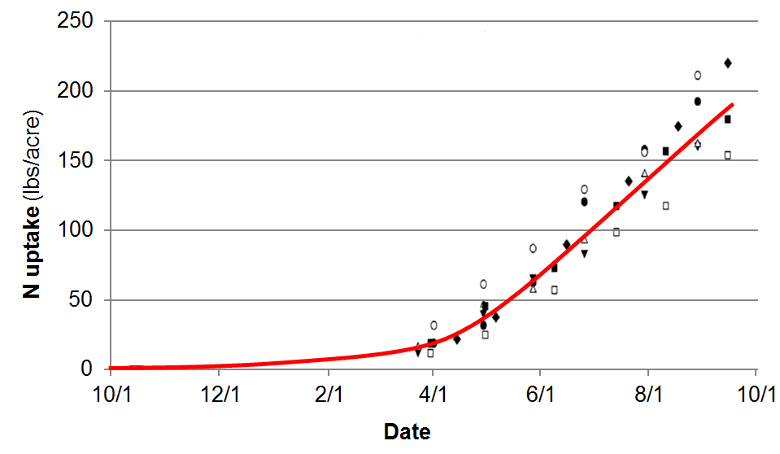
In commercial fields in the Salinas and Pajaro Valleys, aboveground biomass N accumulation averaged approximately 20 lbs/acre through March. From April through mid-September, aboveground biomass N increased linearly, reaching on average 190 lbs/acre [1].
Nitrogen Partitioning
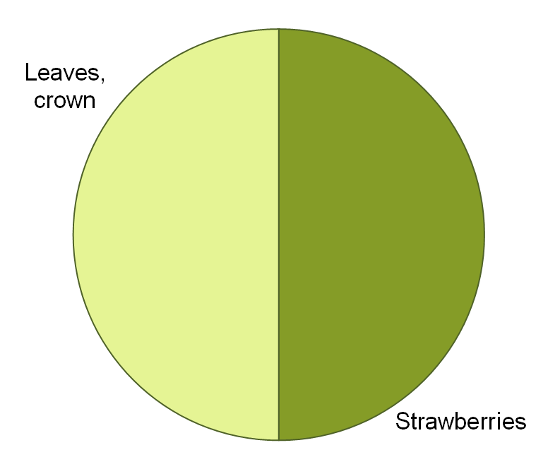
Approximately half of the aboveground N was in the strawberries, while the other half was in the leaves and the crown [1].
Nitrogen Removed at Harvest
Strawberry yield and N removed at harvest.
| Location | Years | Yield | Aboveground N | Harvested N | Source | ||
|---|---|---|---|---|---|---|---|
| (lbs/acre) | (cwt/acre) | (lbs/acre) | (lbs/acre) | (lbs/cwt) | |||
| Salinas and Pajaro Valley | 2010-11 | 71,600 | 716 | 190 | 95 | 0.133 | [1] |
Links
References
- Bottoms, T.G., Hartz, T.K., Cahn, M.D., Farrara, B.F., 2013. Crop and soil nitrogen dynamics in annual strawberry production in California. HortScience 48, 1034–1039.